The infrastructure of running modern enterprises is a company’s lifeblood. Any company’s ability to service customers, make sales, and run operations hinges on having technology that works when we need it…which let’s face it, is all the time.
But benchmarking your operations can be difficult. Companies don’t readily share their struggles, failures, and internal operational details. And data coming from vendors is often skewed to show best-case scenarios for their products.
So how do you cut through the clutter to figure out how your Infrastructure Management organization really measures up?
I’ll provide 3 ways to benchmark your infrastructure management organization. You will also see it in the context of Leaders and Laggards, giving you an idea of where you land on the spectrum.
Even though no two companies are the same…and neither is the technology that runs them…this information should give you some great guideposts and external-based targets.
1. Benchmark Your Infrastructure Uptime
Infrastructure Management is around to keep our technology humming. When we slip up, we cause downtime. In fact, most people don’t know we exist until systems go down.
For these reasons, benchmarking downtime–the result–is a prime way to evaluate your performance.
Perhaps the best data on infrastructure downtime costs were compiled by ESG Global Research. Note the data here is averaged across small to large companies. See the “variance by company size” below to line up better with your peers.
The data breaks down the results into three categories
- Leaders who clock in at 99.98% critical application uptime.
- Average at 99.84%.
- Laggards at 99.66%.
Based on this data, you can quickly benchmark your organization and see where you land on the continuum. It also provides a business case framework to show how improvements in your organization’s performance can lead to cost savings across the broader business.
Here’s the data:
So while Laggards spend a mere fraction of a percent more in downtime, they end up costing their business 40 times more per year.
What does this cost of downtime include? These are business-wide numbers including:
- Lost revenue. It’s tough to buy if your sales portal is down.
- Lost productivity. Have you seen a massive call center sitting idle while phone systems are being restored?
- Cost and labor to recover the systems.
- Costs to restore the systems.
The cost of being an infrastructure management Laggards
Laggards have a difficult life and are costing their companies millions…literally. Laggards spend 24.5x more time in an outage condition. And each outage costs $98,000, which is more than Leaders cause all year. Ultimately, poor infrastructure management results in their company losing $2.9 million each year.
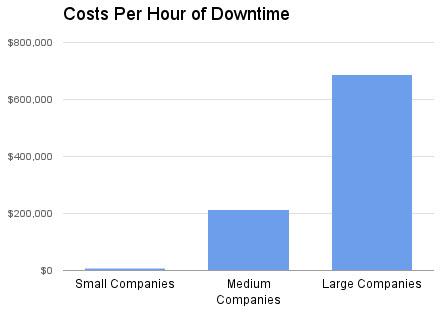
Variance by company size
The numbers presented by ESG Global Research were averaged across multiple business sizes. When you drill into these numbers by company size, you get a pretty focused picture of the average cost of downtime per hour.
Source: Aberdeen Group – Downtime and Data Loss
My thought on this? If you run infrastructure management for a medium or large company, you massive business justification to invest in what it takes to become a Leader.
2. Benchmark by Total Employee-to-IT Worker Ratio
Evaluating your operations using staff count can be an effective way to gain insight into how efficiently you’re performing. A quick and dirty benchmark is to look at the ratio of IT workers to the number of employees in your company.
| Leader Employee to IT Service Desk Worker Ratio | 70:1 |
| Average Employee to IT Service Desk Ratio | 20:1 |
This is an indicator of how your Infrastructure Management organization is performing. Are you providing the type of infrastructure that allows for a slim 70:1 ratio?
Additionally, you can extract a relationship from this “IT Service Desk worker” count. Telecom and NOC Services workers generally run about 11% of IT Service Desk workers (ESG Global Research). This would mean a good number would be a 637:1 ratio of Employees-to-Infrastructure Management Workers.
3. Benchmark by System-to-System Administrator Ratio
Similar to #2, but more specifically focused on Infrastructure Management, this ratio looks at how many System Admins you need to care for your systems at any given time.
- 2016 numbers from TechTarget pegs an average number at 250:1.
- In our own infrastructure field research, BETSOL sees best-in-class performance at a 400:1 ratio.
Does it Cost More to be an Infrastructure Management Leader?
While the benefits of being a Leader are crystal clear, what might be surprising is Leaders often spend less on infrastructure management than Laggards.
That’s right, winners spend less than losers. This is evident particularly in the variance in the staff counts needed to support their company. Apart from saving business millions, they also spend less operationally.
In fact, BETSOL’s own research shows Leaders spend approximately 50% less operationally than Laggards.
This comes down to a more efficient process, people, and technology.
While people and processes are simpler to change, if your infrastructure is aging significantly, you may face significant costs to get up to par, let alone work your way up to Leader. So I don’t want to trivialize the dependency on the right technology. However, as new systems are brought in and architected, if done right, expect low costs and high uptime.
I’ll give you a few ideas on how to accomplish this here.
How do you become a Leader?
Here are 7 of the most common ways I see infrastructure teams hit high uptime while also doing so with low operating costs.
- Leaders have employees with cross-platform technology knowledge, rather than specialists.
- Leaders run true 24x7x365 shops, rather than using on-call procedures.
- Leaders offshore a portion of infrastructure management focused on out-of-hours.
- Leaders are focused on end-user experience and test transactions, rather than the availability of individual nodes and applications.
- Leaders leverage the technology that allows business rules to proactively identify actionable warnings.
- Leaders have slim, virtualized, template-based technology.
- Leaders have the data and analytics to proactively identify where the technology budget should be focused, rather than just reacting.
I’ll be doing a deep dive into each of these in upcoming posts.
Conclusion
Hopefully, this post gives you a couple of fresh perspectives to benchmark your organization. Whether you use it to pat your team on the back for a job well done, or as a way to justify a strategic change, it’s always good to know where you stand competitively.
How are you performing relative to these benchmarks? Do you see other “Leader” traits you’d like to share? Let me know in the comments section below.
[embedit snippet=”after-article-getresponse”]


