Determining Cost of Poor Quality in Software Engineering is how Quality Assurance and Test organizations can value their efforts and ultimately take charge of the software engineering process, end-to-end. It’s the fundamental component of the QA business case, yet most companies…and definitely most software engineering organizations…don’t know their Cost of Poor Quality number. They don’t know the dollar cost of each defect.
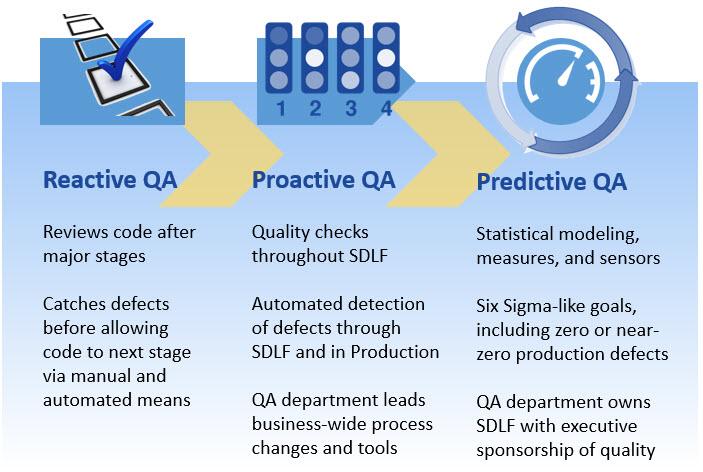
In our last post, Predictive Quality Assurance for Software Engineering, I discussed the transition from reactive QA to proactive and even predictive QA practices. The key to driving this transition is understanding the Cost of Poor Quality (CoPQ).
Cost of Poor Quality Matters
What really happens when bugs and defects make it to production environments? What are the costs even if the defect gets caught before going to production?
In general, the CoPQ for companies is absolutely staggering…when actually calculated and determined. Gaining insight into it is what will be needed to gain executive sponsorship and the organizational changes required to move to Proactive and Predictive QA.
Check this graphic out…
If you want Quality Assurance to move from the back of the assembly line to something that drives processes, decisions, and technology throughout the company, you need executive sponsorship. You need to understand the true impact of mistakes, bugs, defects, security gaps, and general sloppiness.
Examples of Real Cost of Poor Quality
Here are some real-world examples of poor quality:
- While dated, the most comprehensive study on this topic was done in 2002. Major software bugs result in a $60 billion cost to the US Economy (NIST, 2002 [1]). As we are much more ingrained in software today, you can imagine this dollar cost has gone through the roof.
- In 2012, Knight Capital Group had a software bug that resulted in a 30-minute trading issue. The cost? $440 million–that’s four times its 2011 net income! (Intertech)
- Samsung’s cost for the Note 7 problems hit an estimated $10 billion (CNN Money). While initially pointed at batter faults, the further investigation points to a less clear root cause that likely includes software issues.
A quick Google search will show you the list goes on…and on…and on. Most companies, though, do not share the dollar impact.
It has been estimated that in 2013, Amazon would lose $1.2 million per minute if a software glitch impaired purchasing. I’m certain that the number is much higher today. And I’m also certain that executives in Amazon know the precise CoPQ figure.
As a result of Amazon, executives put quality at the forefront. Quality Assurance encircles organizations and culture. QA is not a checklist at the end of the software production line. Amazon is proactive and predictive of its quality management.
Benchmarks for Cost of Poor Quality
Benchmarking the costs of poor quality is very difficult since there are so many variables across industries and businesses, but this is perhaps the best summary I have seen. Credit to iSixSigma.com for this wonderful chart.
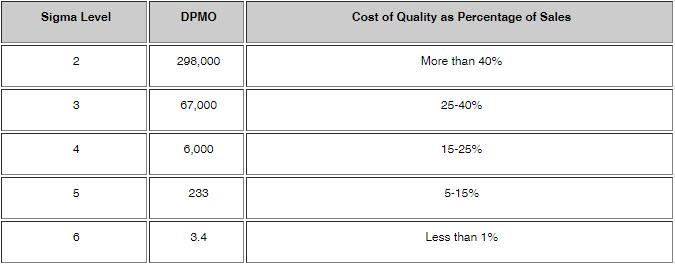
Alright, so what the heck is the supposedly wonderful table telling you?
At Sigma level 2, it says you have 298,000 defects per million opportunities (column 2). If your company is performing at this level, quality issues cost 40%+ of your sales.
At Sigma level 4, it states you have 6,000 defects per million opportunities. That’s a 0.006 defect rate! Super low, but your quality mistakes are still costing you big time–15-25% of sales!
Most companies are in fact in the 15-30% of sales range. You should be embarrassed.
Measuring Your Company’s Software Engineering Cost of Poor Quality
If you’re part of an organization putting out software (products) for either internal use or external use, identifying the true cost of problems can be a challenge…which is why many companies don’t do it…but, there are some tried-and-true methods.
But first, let’s explore the different types of costs that come from releasing defects into production:
- Software engineering and QA rework: How much do those expensive people cost per hour? How much time do they spend fixing vs producing?
- Returns: When customers find defects, many default to requesting a return? What is the end-to-end cost of the return lifecycle? You just went from a lost sale ($0) to a negative cost for the transaction.
- Customer service: When people have trouble with your software, they call. In some cases, they swarm. How much does it cost to handle these inquiries? This is not limited to the salaries of your agents. This is the building space, software, infrastructure, training, benefits, overtime, and much more than all get wrapped into the true cost of running a contact center.
- Marketing costs: When you have software issues, what does your marketing department spend their time on? Instead of expanding, they move to recovery mode. Issuing statements. Asking people to install updates. Putting out social media fires. Addressing concerns, writing FAQs, and more. Think about automobile recalls. Small issues require huge mail, phone, and email campaigns, replete with systematic tracking, reimbursements, and much more complexity. This is not the highest and best use of marketing.
- Brand damage: Both small and big issues can significantly damage your brand. People can have one small bad experience with your brand and decide to use another. This may go by undetected. Additionally, you can have huge uses explode in the media causing the large-scale brand exodus.
- Management overhead: Internally, what happens when issues make it to production? War rooms, executive readouts, PowerPoint presentations, daily meetings, you name it. The productivity cost is massive.
- Much more… You can explore this list from ASQ.org for even more areas of hidden quality costs.
So how do you put this all together into a valid assessment of cost? Here is the approach:
1. Start with Failure Mode Effects Analysis (FMEA)
An FMEA exercise is nothing more than sitting down with various department leads and brainstorming through what happens when a defect hits production. As you list out each process involved, you assign costs, time, and probabilities of occurrence.
The output is an understanding of the likelihood of software defects impacting the business, what the consequences of defects are, and how likely those defects are to be found before they impact customers.
FMEA is not as complicated as it sounds, and will generally be a complete eye-opener for each participant. Silos within companies often blind employees to the true impacts across the entire customer experience.
In fact, versions of the FMEA process have been adapted specifically to software engineering processes and products.
Here’s a presentation from Purdue.edu covering the basic FMEA process.
2. Build Weighted Averages and Probabilities
Leveraging brainstorming, whether, in general, or structured such as FMEA, costs can be assigned to each stage of software delivery. You start this exercise by drawing out the flow of software going from conception, through engineering, to the customer.
For each stage, you can assign an hourly cost. Be sure to include fully loaded costs, including things like people, benefits, building space, infrastructure, etc…
Then you apply a probability of a defect affecting each of these stages.
For example, if every defect must go back to Software Engineering for rework, then defects impact Software Engineering 100% of the time. You can then multiply that by the typical fully-loaded cost for Software Engineering to fix a defect. Similarly, perhaps only 30% of defects only affect Business Analysts.
And don’t forget the customer! Go back earlier into this article and see what happens when a defect makes it to the customer. The costs are staggering, but hopefully, the frequency is low.
With this data, you can then multiply out costs at each stage and add them up for a total defect cost. This will give you an average cost per defect.
To further refine, you would determine costs for minor, major, and catastrophic failures. Each would be its own column in this exercise and each would be assigned a probability of occurring. Each would have different levels of impact at each stage. Once you have these different scenarios outlined, you can take the weighted average, and there you go–you have your cost per defect.
With your defect cost, you can then multiply by your historical defect counts and come up with your Cost of Poor Quality.
It may sound complicated, but if you have the right cross-functional representatives participating, you can come to your number pretty quickly.
Warning: it is common to miss costs and significantly underestimate the impact. For this reason, you must perform heavy due diligence via brainstorming and interviews to gain insight into areas of hidden costs.
3. Refine and Update Your Model
Now that you have a model and figure in place, it’s time to put it to the real-world test. How do you do this? You have measures in place across the process. At each stage of impact, collect data on how often those stages are impacted and what the cost of each impact is. Use this data to continually update and refine your model.
This is a fairly simple process, and something quality-oriented organizations have in place.
Just like in step 2, the big risk here is that you miss cost areas completely. You may have a great model with great measures, but if you’re missing a measurement at a particular stage…or missing a stage completely, you will underestimate costs.
Conclusion
Understanding Cost of Poor Quality at your company is the first step toward gaining executive buy into quality-led operations. This is fundamental to DevOps as well as Proactive and Predictive Quality Assurance. With a CoPQ number in hand, you have the basis for a business case to invest smartly in quality.
Determining CoPQ may sound daunting, but in fact, it’s very achievable and simply requires some tried-and-true methods along with a cross-functional team to get the brainstorming on paper.
If you have CoPQ down, make sure to see how you can leverage it in my article Predictive Quality Assurance for Software Engineering.
Sources:
[1] Arora, A., Caulkins, J., & Telang, R. (2006). Research Note: Sell First, Fix Later: Impact of Patching on Software Quality. Management Science, 52(3), 465-471.
[embedit snippet=”after-article-getresponse”]