Java memory management is an ongoing challenge and a skill that must be mastered to have properly tuned applications that function in a scalable manner. Fundamentally, it is the process of allocating new objects and properly removing unused objects.
Get ready for a deep dive!
In this article, we will be discussing Java Virtual Machine (JVM), understanding memory management, memory monitoring tools, monitoring of memory usage, and Garbage Collection (GC) activities.
As you’ll see, there are many different models, methods, tools, and tips available to truly optimize.
Java Virtual Machine (JVM)
The JVM is an abstract computing machine that enables a computer to run a Java program. There are three notions of JVM: specification (where working of JVM is specified. But the implementation has been provided by Sun and other companies), implementation (known as (JRE) Java Runtime Environment) and instance (after writing Java command, to run Java class, an instance of JVM is created).
The Java Virtual Machine loads the code, verifies the code, executes the code, manages memory (this includes allocating memory from the Operating System (OS), managing Java allocation including heap compaction and removal of garbage objects) and finally provides the runtime environment.
Java (JVM) Memory Structure
JVM memory is divided into multiple parts: Heap Memory, Non-Heap Memory, and Other.

Fig 1.1 source https://www.yourkit.com/docs/kb/sizes.jsp
Heap Memory
Heap memory is the run time data area from which the memory for all java class instances and arrays is allocated. The heap is created when the Java Virtual Machine starts up and may increase or decrease in size while the application runs. The size of the heap can be specified using –Xms VM option. The heap can be of fixed size or variable size depending on the garbage collection strategy. Maximum heap size can be set using –Xmx option. By default, the maximum heap size is set to 64 MB.
Non-Heap Memory
The Java Virtual Machine has memory other than the heap, referred to as Non-Heap Memory. It is created at the JVM startup and stores per-class structures such as runtime constant pool, field and method data, and the code for methods and constructors, as well as interned Strings. The default maximum size of non-heap memory is 64 MB. This can be changed using –XX:MaxPermSize VM option.
Other Memory
Java Virtual Machine uses this space to store the JVM code itself, JVM internal structures, loaded profiler agent code, and data, etc.
Java (JVM) Heap Memory Structure
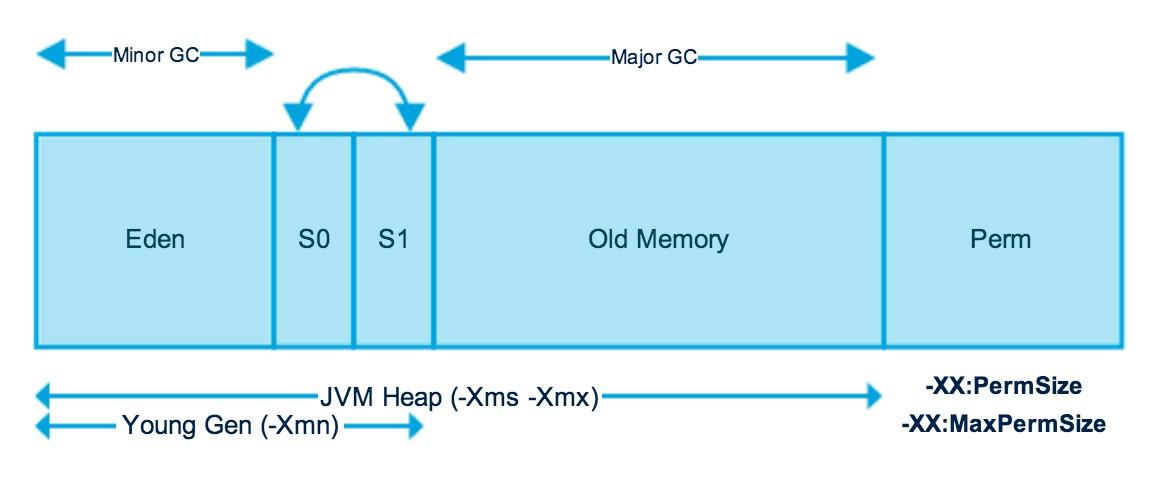
Fig 1.2 source http://www.journaldev.com/2856/java-jvm-memory-model-memory-management-in-java
The JVM heap is physically divided into two parts (or generations): nursery (or young space/young generation) and old space (or old generation).
The nursery is a part of the heap reserved for the allocation of new objects. When the nursery becomes full, garbage is collected by running a special young collection, where all the objects that have lived long enough in the nursery are promoted (moved) to the old space, thus freeing up the nursery for more object allocation. This garbage collection is called Minor GC. The nursery is divided into three parts – Eden Memory and two Survivor Memory spaces.
Important points about the nursery space:
- Most of the newly created objects are located in the Eden Memory space
- When Eden space is filled with objects, Minor GC is performed and all the survivor objects are moved to one of the survivor spaces
- Minor GC also checks the survivor objects and moves them to the other survivor space. So at a time, one of the survivor space is always empty
- Objects that have survived many cycles of GC, are moved to the old generation memory space. Usually, it is done by setting a threshold for the age of the nursery objects before they become eligible to promote to the old generation
When the old generation becomes full, garbage is collected there and the process is called as old collection. Old generation memory contains the objects that are long-lived and survived after many rounds of Minor GC. Usually, garbage collection is performed in Old generation memory when it’s full. Old generation garbage collection is called as Major GC and usually takes longer. The reasoning behind a nursery is that most objects are temporary and short-lived. A young collection is designed to be swift at finding newly allocated objects that are still alive and moving them away from the nursery. Typically, a young collection frees a given amount of memory much faster than an old collection or a garbage collection of a single-generational heap (a heap without a nursery).
Recent releases include a part of nursery called as keep area and it is reserved. The keep area contains the most recently allocated objects in the nursery and is not garbage collected until the next young generation. This prevents objects from being promoted just because they were allocated right before a young collection is started.
Java Memory Models
Permanent Generation (Replaced by Metaspace since Java 8)
Permanent Generation or “Perm Gen” contains the application metadata required by the JVM to describe the classes and methods used in the application. Perm Gen is populated by JVM at runtime based on the classes used by the application. Perm Gen also contains Java SE library classes and methods. Perm Gen objects are garbage collected in a full garbage collection.
Metaspace
With Java 8, there is no Perm Gen, which means there is no more “java.lang.OutOfMemoryError: PermGen” space problems. Unlike Perm Gen which resides in the Java heap, Metaspace is not part of the heap. Most allocations of the class metadata are now allocated out of native memory. Metaspace by default auto increases its size (up to what the underlying OS provides), while Perm Gen always has fixed maximum size. Two new flags can be used to set the size of the metaspace, they are: “-XX:MetaspaceSize” and “-XX:MaxMetaspaceSize”. The theme behind the Metaspace is that the lifetime of classes and their metadata matches the lifetime of the classloaders. That is, as long as the classloader is alive, the metadata remains alive in the Metaspace and can’t be freed.
Code Cache
When a Java program is run, it executes the code in a tiered manner. In the first tier, it uses the client compiler (C1 compiler) in order to compile the code with instrumentation. The profiling data is used in the second tier (C2 compiler) for the server compiler, to compile that code in an optimized manner. The tiered compilation is not enabled by default in Java 7, but is enabled in Java 8.
The Just-In-Time (JIT) compiler stores the compiled code in an area called code cache. It is a special heap that holds the compiled code. This area is flushed if its size exceeds a threshold and these objects are not relocated by the GC.
Some of the performance issues and the problem of the compiler not getting re-enabled has been addressed in Java 8 and one of the solution to avoid these issues in Java 7 is to increase the size of the code cache up to a point never being reached.
Method Area
Method Area is part of space in the Perm Gen and used to store class structure (runtime constants and static variables) and code for methods and constructors.
Memory Pool
Memory Pools are created by JVM memory managers to create a pool of immutable objects. Memory Pool can belong to Heap or Perm Gen, depending on JVM memory manager implementation.
Runtime Constant Pool
Runtime constant pool is a per-class runtime representation of a constant pool in a class. It contains class runtime constants and static methods. Runtime constant pool is part of the method area.
Java Stack Memory
Java stack memory is used for the execution of a thread. They contain method-specific values that are short-lived and references to other objects in the heap that is getting referred from the method.
Java Heap Memory Switches
Java provides a lot of memory switches that we can use to set the memory sizes and their ratios. Some of the commonly used memory switches are:
| VM Switch | VM Switch Description |
| –Xms | For setting the initial heap size when JVM starts |
| -Xmx | For setting the maximum heap size |
| -Xmn | For setting the size of young generation, rest of the space goes for old generation |
| -XX:PermGen | For setting the initial size of the Permanent Generation Memory |
| -XX:MaxPermGen | For setting the maximum size of Perm Gen |
| -XX:SurvivorRatio | For providing ratio of Eden space, for example, if young generation size is 10m and VM switch is –XX:SurvivorRatio=2 then 5m will be reserved for Eden space and 2.5m each for both the Survivor spaces. The default value is 8 |
| -XX:NewRatio | For providing ratio of old/new generation sizes. The default value is 2 |
Table 1.1
Garbage Collection
Garbage Collection is the process of freeing space in the heap for the allocation of new objects. One of the best features of Java is automatic garbage collection. Garbage Collector is the program running in the background that looks into all the objects in the memory and find out objects that are not referenced by any part of the program. All these unreferenced objects are deleted and space is reclaimed for allocation to other objects. One of the basic ways of garbage collection involves three steps:
- Marking: This is the first step where garbage collector identifies which objects are in use and which ones are not in use
- Normal Deletion: Garbage collector removes the unused objects and reclaims the free space to be allocated to other objects
- Deletion with compacting: For better performance, after deleting unused objects, all the survived objects can be moved to be together. This will increase the performance of allocation of memory to newer objects
Mark and Sweep Model of Garbage Collection
JVM uses the mark and sweep garbage collection model for performing garbage collection of the whole heap. A mark and sweep garbage collection consists of two phases, the mark phase, and the sweep phase.
During the mark phase, all the objects that are reachable from Java threads, native handlers and other root sources are marked as alive, as well as the objects that are reachable from these objects and so forth. This process identifies and marks all objects that are still used, and the rest can be considered garbage.
During the sweep phase, the heap is traversed to find the gaps between the live objects. These gaps are recorded in a free list and are made available for new object allocation.
Java Garbage Collection Types
There are five types of garbage collection types that we can use in our applications. We just need to use JVM switch to enable the garbage collection strategy for the application.
Serial GC (-XX:+UseSerialGC): Serial GC uses the simple mark-sweep-compact approach for young and old generations garbage collection that is, Minor and Major GC
To enable the Serial Collector use:
-XX:+UseSerialGC
Parallel GC (-XX:+UseParallelGC): Parallel GC is same as Serial GC except that, it spawns N threads for young generation garbage collection where N is the number of CPU cores in the system. We can control the number of threads using –XX:ParallelGCThreads=n JVM option. This is JVM’s default collector in JDK 8
To enable the Parallel GC, use:
-XX:+UseParallelGC
Parallel Old GC (-XX:+UseParallelOldGC): This is the same as Parallel GC except that it uses multiple threads for both young generation and old generation garbage collection
To enable the Parallel OLDGC, use:
-XX:+UseParallelOldGC
Concurrent Mark Sweep (CMS) Collector (-XX:+UseConcMarkSweepGC): CMS is also referred as concurrent low pause collector. It does the garbage collection for the old generation. CMS collector tries to minimize the pauses due to garbage collection by doing most of the garbage collection work concurrently within the application threads. CMS collector on the young generation uses the same algorithm as that of the parallel collector. This garbage collector is suitable for responsive applications where we can’t afford longer pause times. We can limit the number of threads in CMS collector using –XX:ParallelCMSThreads=n JVM option
To enable the CMS Collector use:
-XX:+UseConcMarkSweepGC
G1 Garbage Collector (-XX:+UseG1GC): The garbage first or G1 Garbage Collector is available from Java 7 and its long term goal is to replace the CMS collector. The G1 collector is a parallel, concurrent and incrementally compact low-pause garbage collector. Garbage first collector doesn’t work like other collectors and there is no concept of young and old generation space. It divides the heap space into multiple equal-sized heap regions. When a garbage collector is invoked, it first collects the region with lesser live data, hence “Garbage First”.
To enable the G1 Collector use:
-XX:+UseG1GC
G1 is planned as the long-term replacement for the Concurrent Mark-Sweep Collector (CMS). Comparing G1 with CMS, there are differences that make G1 a better solution. One difference is that G1 is a compacting collector. G1 compacts sufficiently to completely avoid the use of fine-grained free lists for allocation and instead relies on regions. This considerably simplifies parts of the collector and mostly eliminates potential fragmentation issues. Also, G1 offers more predictable garbage collection pauses than the CMS collector and allows users to specify desired pause targets.
In Java 8, the G1 collector comes with an amazing optimization which is known as String Deduplication. It enables the GC to identify strings that have multiple occurrences across the heap and modify them to point to the same internal char[] array so that there are no multiple copies in the heap.It can be enabled by using -XX:+UseStringDeduplication JVM argument.
G1 is the default garbage collector in JDK 9.
Usage Case
More than 50% of the Java heap is occupied with live data.
The rate of object allocation rate or promotion varies significantly.
Undesired long garbage collection or compaction pauses (longer than 0.5 to 1 second)
Monitoring of Memory Use and GC Activity
Memory shortage is often the cause of instability and unresponsiveness in Java applications. Consequently, we need to monitor the impact of garbage collection on response time and memory usage to ensure both stability and performance. However, monitoring memory utilization and garbage collection times is not enough, as these two elements alone do not tell us if the application response time is affected by garbage collection. Only GC suspensions affect response time directly, and a GC can also run concurrent to the application. We, therefore, need to correlate the suspensions caused by garbage collection with the application’s response time. Based on this we need to monitor the following:
- Utilization of the different memory pools (Eden, Survivor and old generation). Memory shortage is the number-one reason for increased GC activity
- If overall memory utilization is increasing continuously despite garbage collection, there is a memory leak, which will inevitably lead to an out-of-memory. In this case, a memory heap analysis is necessary
- The number of young generation collections provides information on the churn rate (the rate of object allocations). The higher the number, the more objects are allocated. A high number of young collections can be the cause of a response-time problem and of a growing old generation (because the young generation cannot cope with the quantity of objects anymore)
- If the utilization of the old generation fluctuates greatly without rising after GC, then objects are being copied unnecessarily from the young generation to the old generation. There are three possible reasons for this: the young generation is too small, there is high churn rate or there is too much transactional memory usage
- High GC activity generally has a negative effect on CPU usage. However, only suspensions (stop-the-world-events) have a direct impact on response time. Contrary to popular opinion, suspensions are not limited to Major GCs. It is therefore important to monitor suspensions in correlation to application response time
jstat
The jstat utility uses the built-in instrumentation in the Java HotSpot VM to provide information about the performance and resource consumption of running applications. The tool can be used when diagnosing performance issues and in particular, issues related to heap sizing and garbage collection. The jstat utility does not require the VM to be started with any special options. The built-in instrumentation in the Java HotSpot VM is enabled by default. This utility is included in the JDK download for all operating systems. The jstat utility uses the virtual machine identifier (VMID) to identify the target process.
Using jstat command with gc option to find out the JVM Heap Memory usage.
<JAVA_HOME>/bin/jstat –gc <JAVA_PID>
![]()
Fig 1.3
| S0C | Current survivor space 0 capacity (KB) |
| S1C | Current survivor space 1 capacity (KB) |
| S0U | Survivor space 0 utilization (KB) |
| S1U | Survivor space 1 utilization (KB) |
| EC | Current eden space capacity (KB) |
| EU | Eden space utilization (KB) |
| OC | Current old space capacity (KB) |
| OU | Old space utilization (KB) |
| MC | Metasapce capacity (KB) |
| MU | Metaspace utilization (KB) |
| CCSC | Compressed class space capacity (KB) |
| CCSU | Compressed class space used (KB) |
| YGC | Number of young generation garbage collection events |
| YGCT | Young generation garbage collection time |
| FGC | Number of full GC events |
| FGCT | Full garbage collection time |
| GCT | Total garbage collection time |
Table 1.2
jmap
The jmap utility prints the memory-related statistics for a running VM or core file. JDK 8 introduced Java Mission Control, Java Flight Recorder and jcmd utility for diagnosing problems with JVM and Java applications. It is suggested to use the latest utility, jcmd instead of jmap utility for enhanced diagnostics and reduced performance overhead.
The –heap option can be used to obtain the following Java heap information:
- Information specific to the GC algorithm, including the name of GC algorithm (for example, parallel GC) and algorithm-specific details (such as number of threads for parallel GC).
- Heap configuration that might have been specified as command-line options or selected by the VM based on the machine configuration.
- Heap usage summary: For each generation (area of the heap), the tool prints the total heap capacity, in-use memory, and available free memory. If a generation is organized as a collection of spaces (for example, the new generation), then a space specific memory size summary is included.
<JAVA_HOME>/bin/jmap –heap <JAVA_PID>
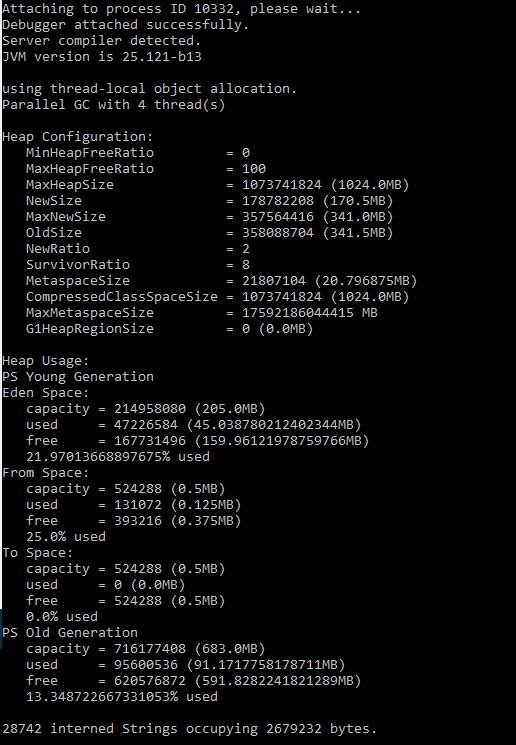
Fig 1.4
jcmd
The jcmd utility is used to send diagnostic command requests to the JVM, where these requests are useful for controlling Java Flight Recordings, troubleshoot, and diagnose JVM and Java applications. It must be used on the same machine where the Java Virtual Machine is running, and have same effective user and group identifiers that were used to launch the JVM.
A heap dump (hprof dump) can be created using the following command:
jcmd <JAVA_PID> GC.heap_dump filename=<FILE>
The above command is same as using
jmap –dump:file=<FILE> <JAVA_PID>
But jcmd is the recommended tool to use.
jhat
The jhat tool provides a convenient means to browse the object topology in a heap snapshot. This tool replaces the Heap Analysis Tool (HAT). The tool parses a heap dump in binary format (for example, a heap dump produced by jcmd). This utility can help debug unintentional object relation. This term is used to describe an object that is no longer needed but is kept alive due to references through some path from the rootset. This can happen, for example, if an unintentional static reference to an object remains after the object is no longer needed, if an observer or listener fails to unregister itself from its subject when it is no longer needed, or if a thread that refers to an object does not terminate when it should. Unintentional object relation is the Java language equivalent of a memory leak.
We can analyze heap dump using jhat with the following command
jhat <HPROF_FILE>
This command reads the .hprof file and starts a server on port 7000.
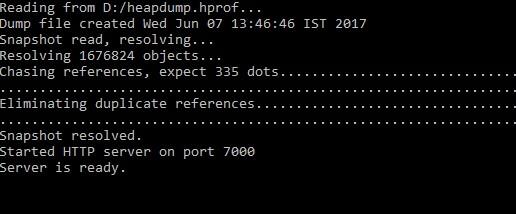
Fig 1.5
When we are connected to the server using http://localhost:7000, we can execute a standard query or create an Object Query Language (OQL). The All Classes query is displayed by default. This default page displays all of the classes present in the heap, excluding platform classes. This list is sorted by fully qualified class name, and broken out by package. Click the name of a class to go to the Class query. The second variant of this query includes the platform classes. Platform classes include classes whose fully qualified names start with prefixes such as java, sun or javax.swing. On the other hand, the class query displays the information about a class. This includes its superclass, any subclasses, instance data members, and static data members. From this page, you can navigate to any of the classes that are referenced, or you can navigate to an instance query. The instance query displays all instances of a given class.
HPROF
HPROF is a tool for heap and CPU profiling shipped with every JDK release. It is a dynamic-link library (DLL) that interfaces with the JVM using the Java Virtual Machine Tool Interface (JVMTI). The tool writes profiling information either to a file or to a socket in ASCII or binary format. The HPROF tool is capable of presenting CPU usage, heap allocation statistics, and monitor contention profiles. In addition, it can report complete heap dumps and states of all the monitors and threads in the Java Virtual Machine (JVM). In terms of diagnosing problems, HPROF is useful when analyzing performance, lock contention, memory leaks, and other issues.
We can invoke the HPROF tool using:
java –agentlib:hprof ToBeProfiledClass
java –agentlib:hprof=heap=sites ToBeProfiledClass
Depending on the type of profiling requested, HPROF instructs the JVM to send it to the relevant events. The tool then processes the event data into profiling information. By default, heap profiling information is written out to java.hprof.txt (in ASCII) in the current working directory.
The following command
javac –J-agentlib:hprof=heap=sites Hello.java
can be used to obtain heap allocation profile. A crucial piece of information in the heap profile is the amount of allocation that occurs in various parts of the program.
Similarly, a heap dump can be obtained using heap=dump option. The output of
javac –J-agentlib:hprof=heap=dump Hello.java
consists of the root set as determined by the garbage collector, and an entry for each Java object in the heap that can be reached from the root set.
The HPROF tool can collect CPU usage information by sampling threads.
The following command can be used to get the CPU usage sampling profile results:
javac –J-agentlib:hprof=cpu=samples Hello.java
The HPROF agent periodically samples the stack of all running threads to record the most frequent active stacktraces.
There are other tools such as VisualVM which provides us the detailed information of memory usages, garbage collections, heap dumps, CPU and memory profiling, etc. in the form of GUI.
VisualVM
VisualVM is a tool derived from the NetBeans platform and its architecture is modular in design meaning it is easy to extend through the use of plugins. VisualVM allows us to get detailed information about Java applications while they are running on a JVM and it can be in a local or a remote system. Data generated can be retrieved using Java Development Kit (JDK) tools and all the data and information on multiple Java applications can be viewed quickly for both local and remote running applications. It is also possible to save and capture the data about the Java Virtual Machine JVM software and save data to the local system. VisualVM can do CPU sampling, memory sampling, run garbage collections, analyze heap errors, take snapshots and more.
Enabling JMX Ports
We can enable the JMX remote ports by adding the following system properties while starting the Java application:
- -Dcom.sun.management.jmxremote
- -Dcom.sun.management.jmxremote.port=<Port>
- -Dcom.sun.management.jmxremote.
We can now use VisualVM to connect to the remote machine and view the CPU utilization, memory sampling, threads etc. We can also generate thread dumps and memory dumps on the remote machine when connected through JMX Remote port.
Fig 1.6 shows a list of applications that are running on local and on remote systems. To connect to a remote system, right-click on “Remote” and add a hostname and under Advanced Settings, define the port which was used when starting the application on the remote machine. Once there are applications listed under local or remote section, double click on them to view the details of the application.
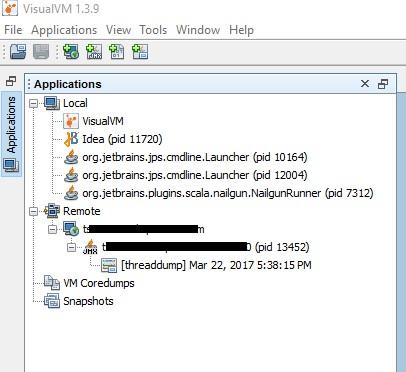
Fig 1.6
There are four tabs for the details of the application: Overview, Monitor, Threads, and Sampler.
The Overview tab contains main information about the launched application. The main class, the arguments of the command line, JVM arguments, PID, system properties and any saved data such as thread dumps or heap dumps are available in the overview tab.
The interesting tab is the Monitor tab. This tab displays the CPU and memory usage of the application. There are four graphs in this view.
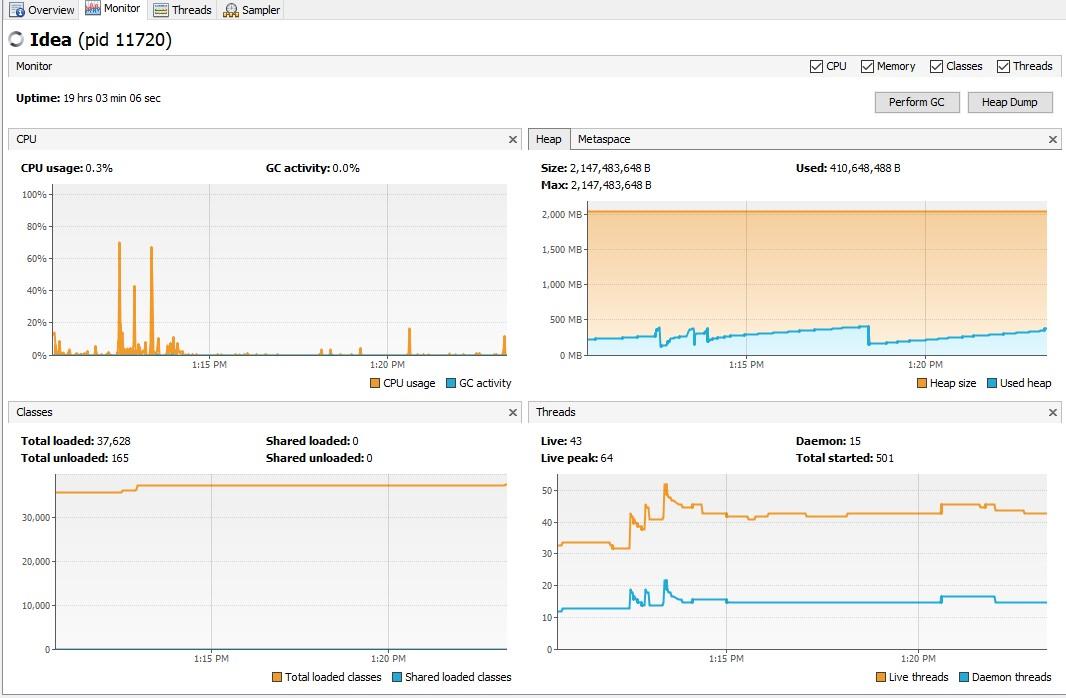
Fig 1.7
The first graph displays the CPU usage and the garbage collector CPU usage. The X-axis shows the timestamp against the percentage of utilization.
The second graph that is on the top-right displays the heap space and Perm Gen space or Metaspace. It also shows the maximum size of the heap memory, how much is being used by the application and how much is available for use. This graph is particularly useful in analyzing applications that are experiencing java.lang.OutOfMemoryError: Java heap space errors. When an application is performing a memory-intensive job, the used heap (represented in blue color on the graph) should always be less than the heap size (represented in orange color on the graph). When used heap is almost same as the heap size or when there is no more space for the system to allocate/expand the heap size and the used heap keeps on increasing, then we can expect a heap error. More information about the heap can be obtained by taking a “Heap Dump”. When there is an out-of-memory error, heap dump can be obtained by adding the flowing VM parameters:
-XX:+HeapDumpOnOutOfMemoryError –XX:HeapDumpPath=[file path]
This will enable the .hprof file to be created in the specified path.
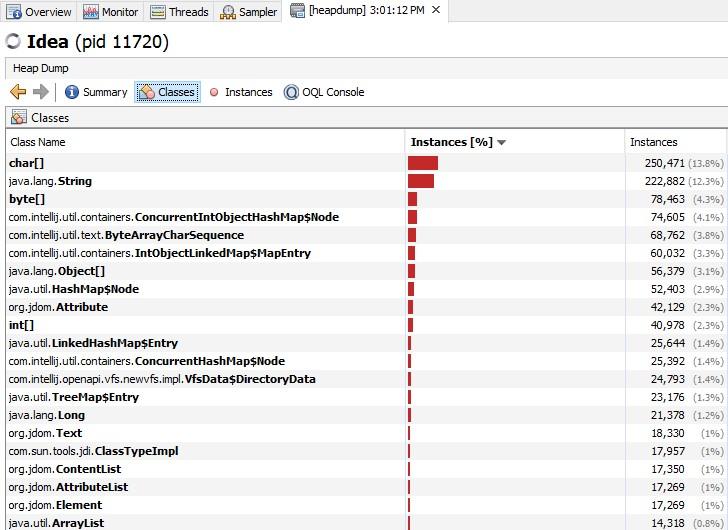
Fig 1.8
Fig 1.8 displays the heap dump for one of the applications. The summary tab displays some basic information such as total classes, total instances, classloaders, GC roots and the environment details in which the application is running. The analysis in Fig 1.8 shows which types of objects are allocated most and where these allocations occur. Large objects create a lot of other objects in their constructor or have a lot of fields. We should also analyze code areas that are known to be massively concurrent under production conditions. Under load, these locations will not only allocate more, but they will also increase synchronization within the memory management itself. High memory utilization is the cause for excessive garbage collection. In some cases, hardware restrictions make it impossible to simply increase the heap size of the JVM. In other cases, increasing the heap size does not solve but only delays the problem because the utilization just keeps growing. The following analyses are possible using the heap dumps identification of memory leaks and identification of memory eater.
Every object that is no longer needed but remains referenced by the application can be considered a memory leak. Practically, we care only about memory leaks that are growing or that occupy a lot of memory. A typical memory leak is one in which a specified object type is created repeatedly but not garbage-collected. To identify this object type, multiple heap dumps are needed which can be compared using trending dumps. Every Java application has a large number of String, char[] and other Java standard objects. In fact, String and char[] will typically have the highest number of instances, but analyzing them would take us nowhere. Even if we were leaking String objects, it would most likely be because they are referenced by an application object, which represents the root cause of the leak. Therefore, concentrating on classes of our application will yield faster results.
There are several cases when we want to do a detailed analysis.
- The trending analysis did not lead us to the memory leak
- Our application uses too much memory but has no obvious memory leak and we need to optimize the code
- We could not do a trending analysis because memory is growing too fast and the JVM is crashing
In all three cases, the root cause is most likely one or more objects that are at the root of a larger object tree. These objects prevent a whole lot of other objects in the tree from being garbage-collected. In case of an out-of-memory error, it is likely that a handful of objects prevent a large number of objects from being freed, hence triggering the out-of-memory error. The size of the heap is often a big problem for memory analysis. Generating heap dump requires memory itself. If the heap size is at the limit of what is available or possible (32-bit JVMs cannot allocate more than 3.5 GB), the Java Virtual Machine (JVM) might not be able to generate one. In addition, a heap dump will suspend the JVM. Manually finding the one object that prevents a whole object tree from being garbage-collected quickly becomes the proverbial needle in a haystack.
Fortunately, solutions like Dynatrace is able to identify these objects automatically. To do this we need to use a dominator algorithm that stems from the graph theory. This algorithm should be able to calculate the root of an object tree. In addition to calculating object tree roots, the memory analysis tool calculates how much memory a particular tree holds. This way it can calculate which objects prevent a large amount of memory from being freed – In other words, which object dominates memory.
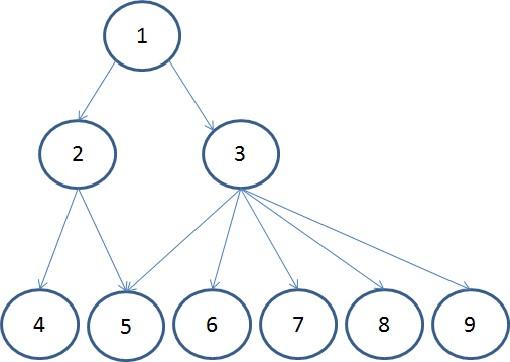
Fig 1.9
Coming back to graphs available (Fig 1.7) for an application under the Monitor tab is the classes graph which is situated at the bottom left. This graph displays the total number of classes loaded in the application and the last graph displays the number of threads currently running. With these graphs, we can see if our application is taking too much of CPU or memory.
The third tab is the Threads tab.
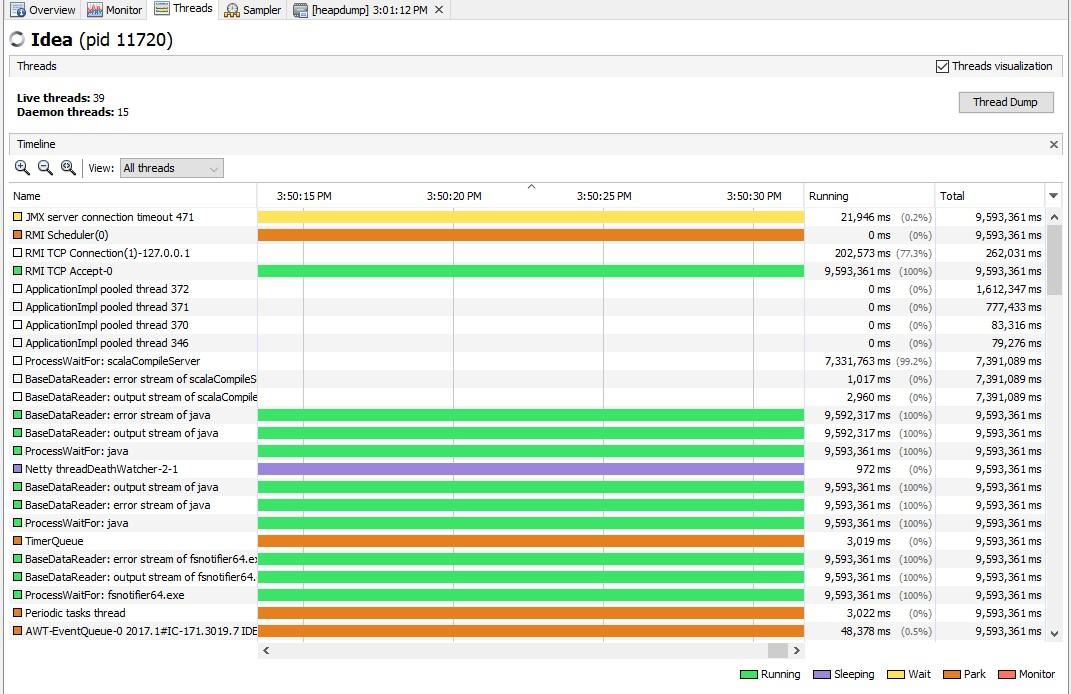
Fig 1.10
In the threads tab, we can see how different threads of the application are changing state and how they evolve. We can also observe the time pass in each state and many other details about the threads. There are filtering options to view only the live threads or finished threads. If we need a thread dump, then it can be obtained by using the “Thread Dump” button on the top.
The fourth tab is the Sampler tab. When we open this tab initially, it contains no information. We must start one kind of sampling/profiling before seeing the information. We will start with CPU sampling. After clicking the “CPU” button, the results of the CPU sampling are displayed in the table.
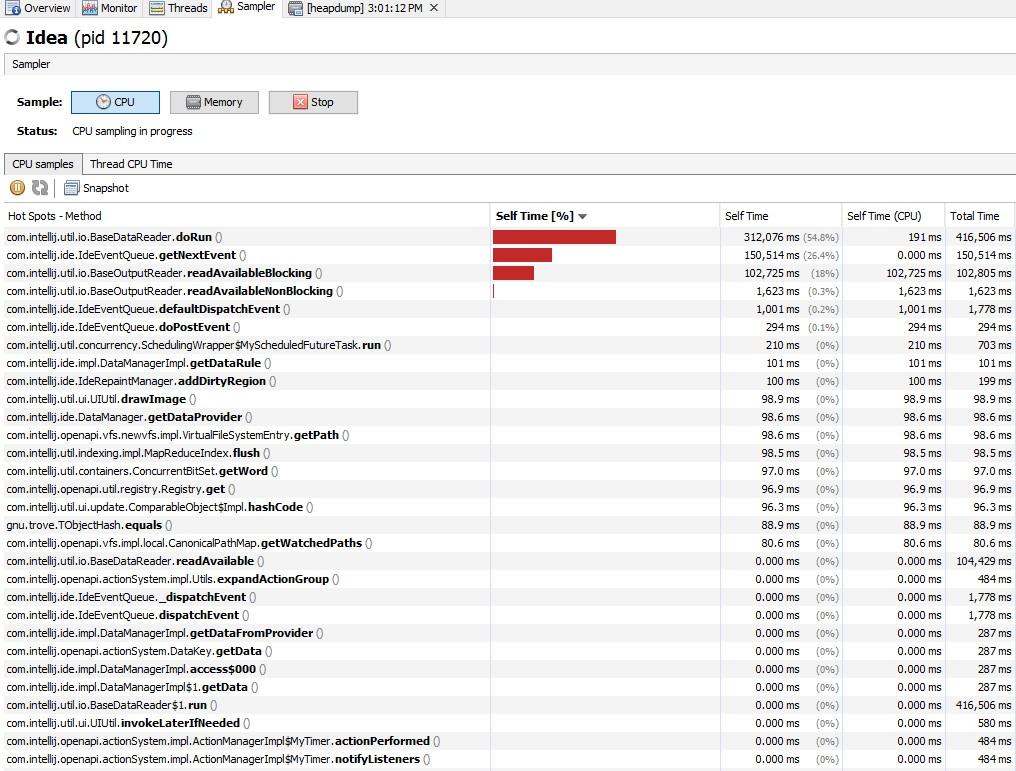
Fig 1.11
From Fig 1.11, we see that the doRun() method takes 54.8% of the CPU time. We also see that getNextEvent() and readAvailableBlocking() are the two next methods which consume more CPU time.
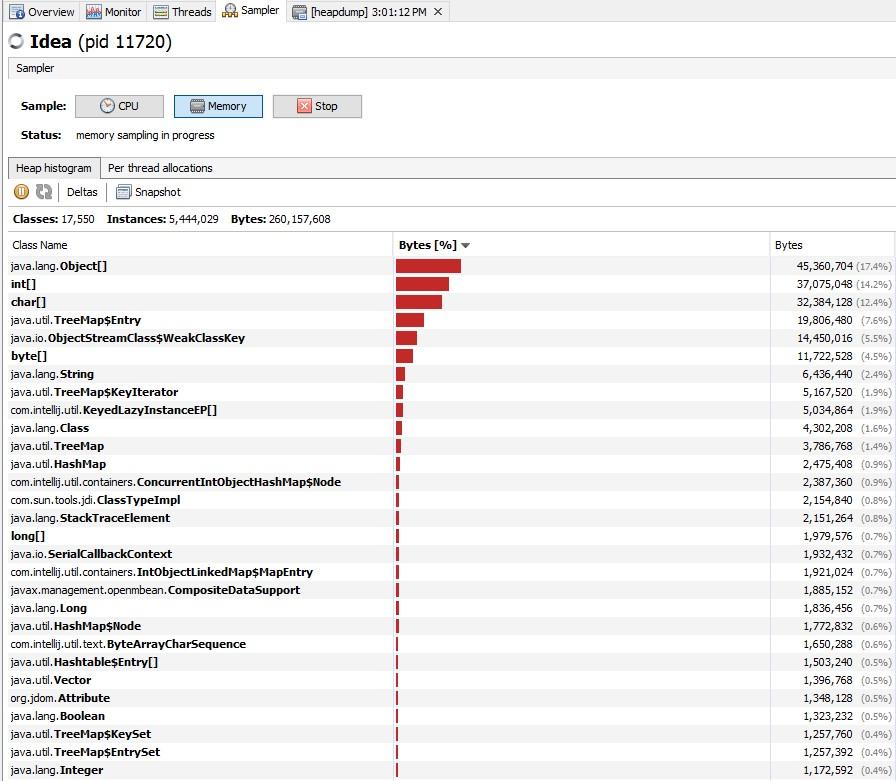
The next sampling is the Memory sampling. The application would be frozen during the sampling until the results are fetched. From Fig 1.12, we can infer that the application stores arrays of Object, int, and char.
In both types of sampling we can save the results for later use to a file. For example, sampling can be taken multiple times at regular intervals and the results can be compared. This can help us improve the application to use less CPU and memory. Finally, it is the task of the developer to examine these areas and improve the code.
Java Garbage Collection Tuning
Java garbage collection tuning should be last option we use for increasing the throughput of the application and only when we see a drop in performance because of longer GC causing application timeouts.
If we come across java.lang.OutOfMemoryError: PermGen space error, then try to monitor and increase the Perm Gen memory space using –XX:PermGen and –XX:MaxPermGen JVM options. We do not see this error in the case of Java 8 and above. If we see a lot of full GC operations, then we should try increasing the old generation memory space. Overall, garbage collection tuning takes a lot of effort and time and there is no hard and fast rule for that. We need to try different options and compare them to find out the best one suitable for our application.
Some of the performance solutions are:
- Application software sampling/profiling
- Server and JVM tuning
- Right hardware and OS
- Code improvement as per the behavior of the application and sampling results (easier said than done!)
- Use Java Virtual Machine the right way (Having optimal JVM parameters)
- -XX:+UseParallelGC if there are multiprocessors
Some other useful tips to keep in mind:
- Unless we have a problem with pauses, try granting as much memory as possible to the JVM
- Setting –Xms and –Xmx to the same value
- Be sure to increase the memory as we increase the number of processors, since allocations can be parallelized
- Don’t forget to tune the Perm Gen
- Minimize the use of synchronizations
- Use multithreading if it benefits and be aware of the thread overheads. Also, be sure it works the same way across different environments
- Avoid premature object creation. Creation should be close to the actual place of use. This is a basic concept that we tend to overlook
- JSPs are usually slower than servlets
- StringBuilder instead of string concat
- Use primitives and avoid objects. (long instead of Long)
- Reuse objects where possible and avoid creating unnecessary objects
- equals() is expensive if we are testing for an empty string. Use length property instead.
- “==” is faster than equals()
- n += 5 is faster than n = n + 5. Fewer byte codes are generated in the first case
- Flush and clear out hibernate sessions periodically
- Perform updates and deletes in bulk
Generating Logs for GC
The Garbage collector log, or gc.log, is the text file where all the JVM memory clean-up events are stored: MinorGC, MajorGC e FullGC.
Launch JVM with below parameters to create gc.log:
until Java 8
XX:+PrintGCDetails -Xloggc:/app/tmp/myapp-gc.log
from Java 9
Xlog:gc*:file=/ app/tmp/myapp-gc.log
Sources
https://docs.oracle.com/cd/E13150_01/jrockit_jvm/jrockit/geninfo/diagnos/garbage_collect.html
https://en.wikipedia.org/wiki/Java_virtual_machine
https://www.javatpoint.com/internal-details-of-jvm
https://dzone.com/articles/java-performance-tuning
http://www.journaldev.com/2856/java-jvm-memory-model-memory-management-in-java
https://www.yourkit.com/docs/kb/sizes.jsp
https://www.infoq.com/articles/Java-PERMGEN-Removed
http://blog.andresteingress.com/2016/10/19/java-codecache
https://docs.oracle.com/javase/8/docs/technotes/guides/troubleshoot/toc.html
We hope this article (Java Memory Management for Java Virtual Machine) has been valuable. If there’s anything you’d like to add, let us know in the comments below!
Be sure to check out our other blog: DevOps Using Jenkins, Docker, and Kubernetes, Get Started with Sikuli for Test Automation, Automation Related to DevOps, and more here.
This article was contributed to and written by Akshay A and Abhijith Arkalgud.